Table of Contents
The Imperative for Procurement Visibility
In today’s complex business environment, gaining clear visibility into procurement spend isn’t just about cost savings; it’s a strategic necessity. Yet, many organizations struggle to consolidate and analyze procurement data scattered across ERP systems, P2P platforms, and spreadsheets. My research indicates that companies lacking unified spend visibility often miss significant opportunities for negotiation leverage, risk mitigation, and process efficiency.
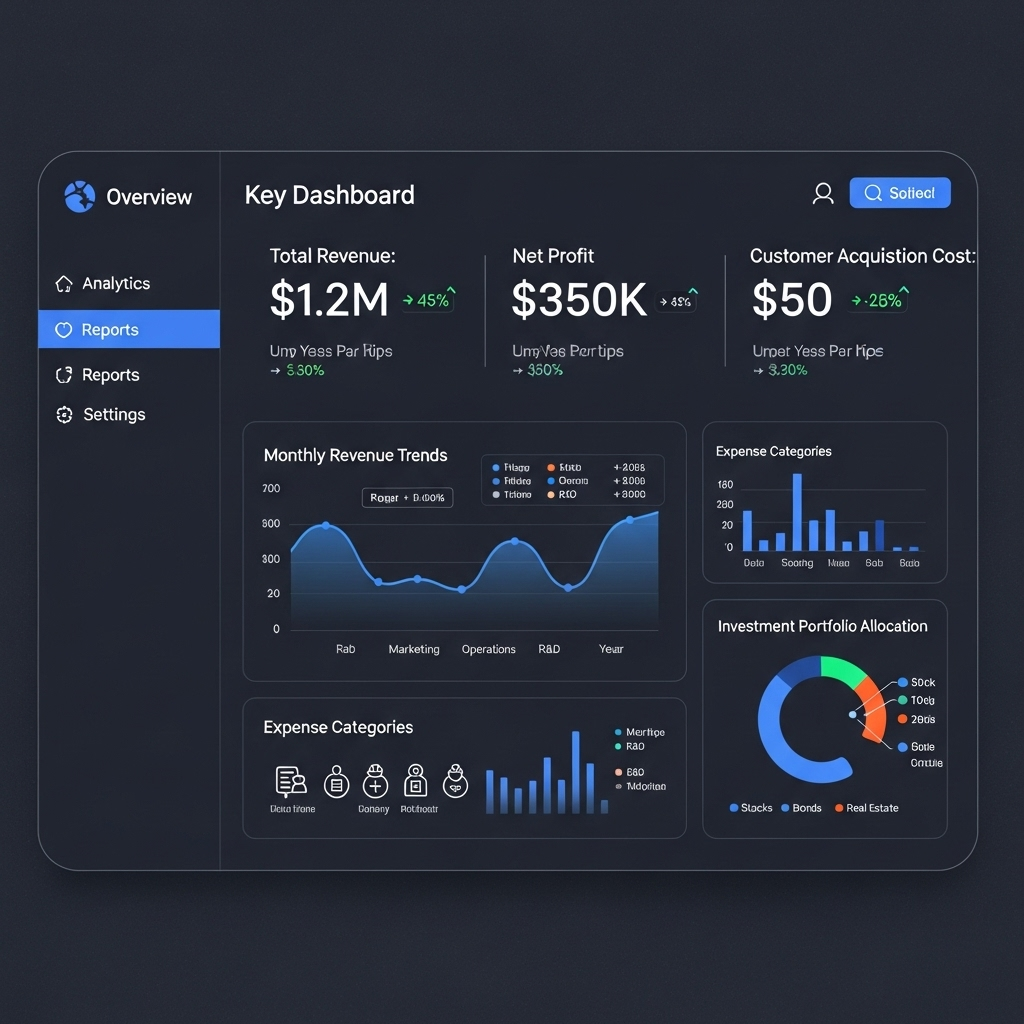
Effective procurement spend dashboards bridge this gap, transforming raw transactional data into actionable intelligence. Building such a dashboard, however, requires more than just technical skill; it demands a clear understanding of key procurement metrics and thoughtful design.
Key Metrics for Procurement Spend Dashboards
An impactful dashboard focuses on metrics that drive decisions. For procurement, essential KPIs often include:
- Spend by Category/Supplier: Visualizing spend distribution (e.g., using treemaps or bar charts) quickly highlights concentration risks and negotiation opportunities. Tracking trends over time adds another layer of insight.
- Supplier Performance: Metrics like on-time delivery rates, quality scores, and contract compliance (if data is available) provide a more holistic view beyond just cost.
- Maverick Spend:** Identifying purchases made outside of established contracts or preferred suppliers (often shown as a percentage of total spend) pinpoints areas needing better policy enforcement or process improvement.
- Savings Tracked: Quantifying negotiated savings versus budget or previous periods demonstrates procurement’s value contribution. Visualizing realized vs. potential savings can be powerful.
- Payment Term Analysis: Understanding average payment terms by supplier can inform working capital optimization strategies.
Presenting these metrics clearly, often starting with a high-level overview and allowing drill-down into specifics, is crucial.
Dashboard Structure and Design Considerations
A well-structured dashboard guides the user logically. Common layouts feature:
- Overview Page: High-level KPIs, overall spend trends, and key alerts.
- Category Analysis Page: Deep dives into specific spend categories, top suppliers within categories, and category-specific trends.
- Supplier Analysis Page: Detailed views of individual supplier spend, performance metrics, and contract details.
From a design perspective, clarity is paramount. Using consistent color schemes, clear labeling, and avoiding chart clutter ensures the information is easily digestible. Interactivity, allowing users to filter by date range, business unit, or category, empowers self-service analysis.
Technology Choices: Power BI, Tableau, or Custom?
While various tools can build procurement dashboards, Power BI and Tableau are common choices due to their robust data connection and visualization capabilities. Power BI is often favored in Microsoft-centric organizations, offering strong integration with Excel and other Microsoft products, and its data modeling capabilities are well-suited for complex procurement data. Tableau is known for its intuitive interface and powerful visual exploration features, enabling users to easily drill down and discover insights. In scenarios requiring highly bespoke visualizations, complex integrations not easily handled by BI tools, or specific UI/UX demands, a custom solution using libraries like React might be considered, though development effort is significantly higher. The choice often depends on existing organizational standards, specific integration needs (e.g., connecting to NetSuite, SAP Concur, Workday), and the technical skillsets available.
Implementation Insights (Analyst View)
From an analytical standpoint, successful dashboard implementation hinges on several factors. Crucially, Data Quality is paramount; procurement data often requires significant cleansing and standardization before visualization. Stakeholder Alignment is also vital, ensuring the dashboard addresses the specific questions and needs of procurement, finance, and operational teams. Finally, an Iterative Development approach, starting with core metrics and gradually adding complexity based on user feedback, typically yields better results than attempting a “big bang” approach.
Advanced Analytics and Future Capabilities
Modern procurement dashboards increasingly incorporate predictive analytics capabilities. Trend forecasting helps organizations anticipate spend patterns and budget requirements. Risk scoring models can flag suppliers exhibiting concerning patterns in delivery, quality, or financial stability.
Machine learning integration enables automated anomaly detection, identifying unusual spending patterns that may indicate process issues or potential fraud. Natural language processing capabilities can analyze contract terms and supplier communications to extract additional insights for dashboard visualization.
Mobile optimization ensures stakeholders can access critical procurement insights regardless of location, supporting faster decision-making in dynamic business environments.
A well-designed procurement spend dashboard is a dynamic tool, evolving alongside business needs and data maturity. It moves procurement analysis from reactive reporting to proactive, strategic decision support.
How does your organization visualize procurement spend? Let’s discuss the challenges and successes. Connect with me on LinkedIn.