Table of Contents
It’s More Than Just a Platform Choice
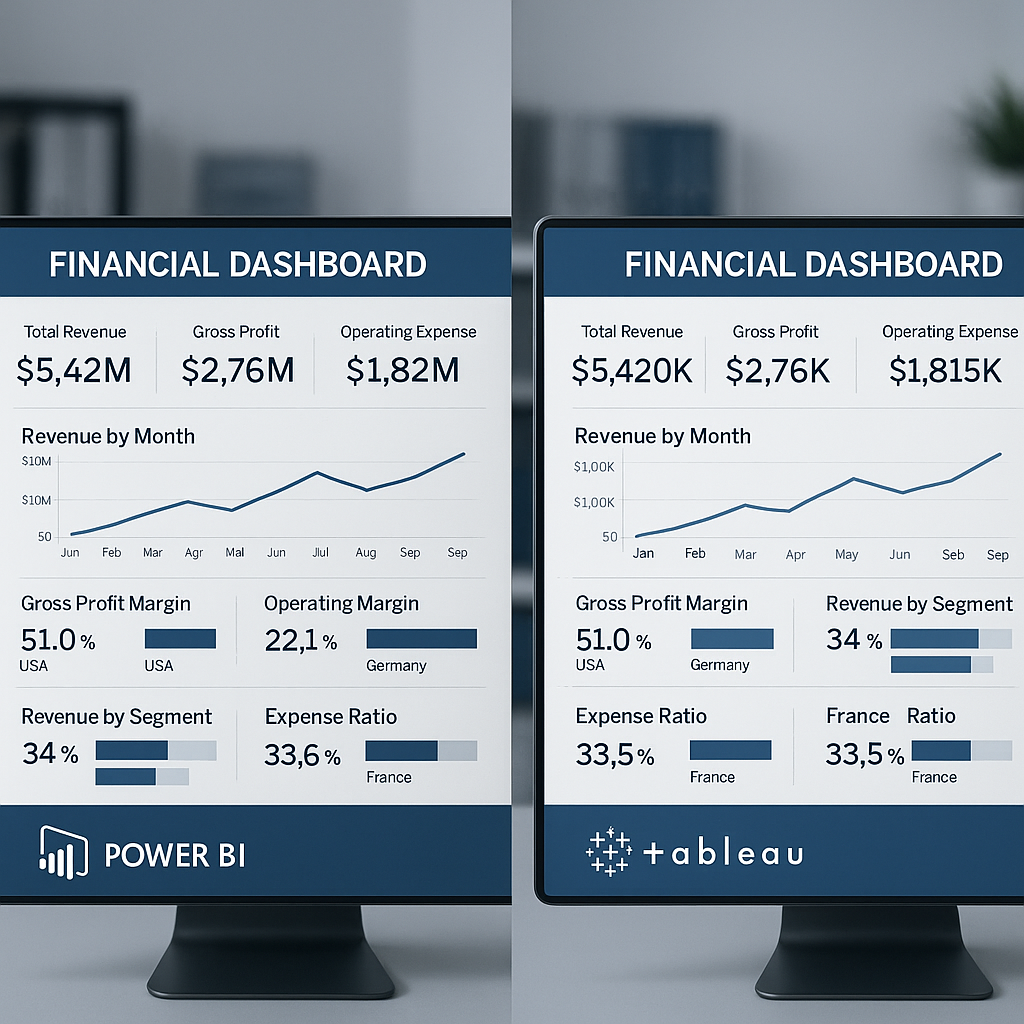
Financial organizations face a critical decision when implementing dashboard solutions: Power BI or Tableau? But let’s be clear, this choice isn’t just a simple feature comparison. It’s a strategic commitment to how your financial teams will interact with data, how systems will integrate, and how insights will scale across the organization. It’s the kind of decision that sends ripples across the pond.
Insights distilled from numerous complex system deployments indicate that successful outcomes don’t hinge on platform-specific capabilities alone. Instead, they depend on a clear-eyed assessment of your organization’s maturity, integration complexity, and, most importantly, your team’s readiness for adoption.
Capabilities and the Integration Puzzle
Both platforms offer robust toolkits for financial dashboard development. Power BI excels in its tight integration with the Microsoft ecosystem, making it an almost default choice for organizations already invested in Office 365 or Dynamics ERP solutions. Its native connectors and dataflows provide streamlined, almost plug-and-play access to common enterprise systems.
Tableau, conversely, boasts more sophisticated visualization options and broader data source connectivity. If your tech stack is a patchwork quilt of different vendors, you’ll likely find Tableau’s flexibility advantageous for connecting disparate systems and wrangling complex data transformations.
The integration approach you take will significantly impact implementation timelines and ongoing maintenance. I’ve seen organizations navigate these decisions successfully, and they almost always emphasize evaluating both platforms against their existing infrastructure and their future ambitions.
Can It Scale? Performance Under Pressure
Financial dashboards aren’t just pretty pictures; they often handle substantial data volumes with real-time demands. Both platforms perform well, but how they scale is a different story.
Power BI’s cloud-native architecture provides straightforward scalability, especially for organizations leveraging Microsoft Azure. Its paginated reports and mobile optimization make it well-suited for widespread adoption across large financial teams (a key factor that’s often overlooked).
Tableau’s approach to scaling is more about performance optimization through meticulous data preparation and caching. Organizations with heavy-duty analytical requirements often find its advanced calculation engine is a better fit for sophisticated financial modeling.
User Adoption: The Human Element
The most successful implementations I’ve observed prioritize the user experience from day one. It sounds obvious, but it’s frequently ignored. Power BI’s native integration with Office tools creates a familiar environment, which naturally reduces the learning curve for finance professionals who live in Excel.
Tableau’s intuitive drag-and-drop interface, on the other hand, appeals to users who prefer a more visual, exploratory approach to data analysis. But does that flexibility come at a cost? Sometimes. It can lead to governance headaches, particularly in regulated financial environments where a clear audit trail isn’t just nice to have, it’s mandatory.
High adoption rates don’t happen by accident. They’re the result of structured training programs tailored to the chosen platform.
The True Cost of Ownership
You have to look past the initial licensing fees. Power BI’s per-user model can be more predictable for organizations with stable headcounts, while Tableau’s flexible licensing might better suit companies with fluctuating user needs.
However, both platforms require significant investment in data prep, governance, and ongoing support. The organizations that manage these costs effectively establish clear governance frameworks early, ensuring the platform’s capabilities stay aligned with business requirements.
A Strategic Framework, Not Just a Scorecard
A structured approach that considers both technical and organizational factors is critical. When organizations make this decision strategically, their choice often reflects a broader philosophy on technology and data management, not just a response to immediate functional needs.
The platforms are just sophisticated tools. Their real effectiveness depends entirely on how well they align with your company’s capabilities, processes, and long-term goals. This alignment is what separates a dashboard that delivers real business value from one that just looks good in a presentation.
Curious about how Power BI or Tableau could enhance your financial dashboard capabilities? Let’s connect and explore the possibilities on LinkedIn.