Table of Contents
The Evolution of Financial Reporting
Financial reporting has undergone a remarkable transformation. Have you noticed the shift? We’ve moved from static, paper-based financial statements, often delivered weeks post-close, to dynamic, interactive dashboards providing near real-time insights. This isn’t just a format change; it’s a fundamental reimagining of how financial data creates value and informs strategy, turning historical records into current navigation tools.
My research highlights the increasing limitations of traditional reporting: quarterly statements quickly become outdated, many Excel reports demand tedious manual updates, and accompanying narratives often lack immediately actionable context. While traditional reports retain archival value, their role in daily operational guidance is diminishing.
Why Interactive Dashboards Are Transforming Finance
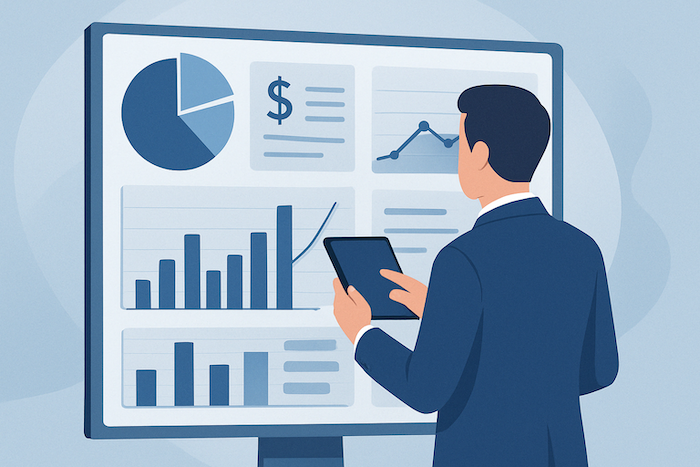
Interactive dashboards address these limitations by changing our interaction with financial data. Unlike the rigid, calendar-driven cycle of traditional reporting, dashboards enable continuous monitoring and a proactive stance. Metrics can update frequently, allowing finance leaders to spot trends, identify anomalies, or capitalize on opportunities as they emerge, not weeks later. I recall an organization where an interactive dashboard helped pinpoint significant margin erosion within days, triggering corrective pricing much faster than their previous monthly reviews ever could. This agility is invaluable.
Static reports offer a single, pre-digested view; interactive dashboards empower users. They can explore information driven by specific questions (filtering across dimensions like product lines or regions, drilling down from summaries to transaction details, and toggling visualizations for new perspectives). This exploratory capability is crucial for fostering data literacy.
Furthermore, by integrating data from multiple sources (financial systems, operational databases, CRMs, external market data), these dashboards create a holistic performance view. This integration reveals complex links between financial outcomes and operational drivers, leading to more informed, well-rounded decisions.
Key Components of Effective Financial Dashboards
What elevates a dashboard from merely informative to genuinely effective? It’s more than just appealing visuals; several critical components reflect a deep understanding of financial principles and user psychology.
Visual Hierarchy and Strategic Focus
Effective dashboards use a clear visual hierarchy, immediately highlighting critical Key Performance Indicators (KPIs) while keeping supporting details accessible but unobtrusive. They avoid overwhelming users, focusing on KPIs aligned with strategic objectives. Think of the dashboard telling a story, with headlines grabbing attention and subplots available for deeper dives. This demands careful layout, color, and emphasis.
Contextual Comparisons and Benchmarking
Numbers gain meaning through context. Benchmarks (targets, historical trends, prior period performance, or even anonymized peer comparisons) are vital for users to evaluate performance accurately. Without these reference points, metrics can lack actionable meaning. “Revenue: $1.2M” is less useful than “Revenue: $1.2M (Target: $1.1M, +9%)”.
Interactive Exploration and Drill-Down Capability
The true power of modern dashboards lies in their interactivity. Dynamic filtering (by date, department, product), drilling down from summaries to constituent parts, and pivoting views allow users to answer their questions. This transforms reporting from passive consumption to active discovery, enabling users to move from “what happened” to “why did it happen.”
Data Quality and Trustworthiness
Underpinning any effective dashboard is unwavering data quality. If users suspect inaccuracies or outdated information, the dashboard, however well-designed, will be abandoned. Robust data governance, clear data lineage, and transparent update frequencies are essential.
Implementation Strategies: Tools and Approach
Successful dashboard projects result from careful planning and a user-centric approach. They start by understanding user decisions and required information, then designing the interface. It’s crucial to always keep core UX principles in mind, whether using tools like Power BI, Tableau, or developing custom React applications.
The choice of technology (Power BI, Tableau, React, etc.) should follow requirements. Power BI offers strong Microsoft ecosystem integration, Tableau is known for powerful visualization, and custom React builds provide ultimate flexibility for unique needs, albeit with higher development overhead.
A vital aspect is an iterative process: deploy an initial version (MVP), monitor user interaction, gather feedback, and refine designs. This agile approach ensures the dashboard evolves to meet real-world needs. Training and support are also key to driving adoption.
Future Trends
Several emerging trends promise to further shape financial reporting and dashboards:
- AI-Powered Analytics: Dashboards are increasingly embedded with AI to automatically identify significant patterns, flag anomalies, or suggest potential causes for variances.
- Natural Language Interfaces: Users querying data with plain language (e.g., “Show sales trends for Product X last quarter”) is becoming more common, lowering technical barriers.
- Embedded Decision Support: Future dashboards will likely offer more prescriptive insights, recommending actions based on trends and predictive models, moving from informational tools to active decision-making partners.
Moving Forward
Interactive dashboards are more than a cosmetic upgrade to financial statements; they signify a new paradigm for financial reporting in driving business success. By embracing this shift, finance organizations can evolve from backward-looking scorekeepers into indispensable, forward-looking strategic partners. The journey demands technological adoption, a commitment to data quality, and a relentless focus on the end-user.
Connect with me on LinkedIn for more insights on financial technology and accounting innovation.