Table of Contents
As enterprise systems become increasingly distributed, cloud-native, and complex, the traditional approach to monitoring has become insufficient. Siloed tools for infrastructure monitoring, application performance management (APM), and log analysis create a fragmented view. This makes it nearly impossible to quickly diagnose and resolve issues.
This is where the concept of observability comes into play. It’s not just about collecting data; it’s about being able to ask arbitrary questions about your system’s state without having to predefine the questions you might need to ask. Datadog has emerged as a leader in this space by offering a unified, full-stack observability platform.
The Unified Observability Approach
A perspective forged through years of navigating real-world enterprise integrations suggests that the primary challenge in modern IT operations is not a lack of data, but a lack of context. When an application fails, is it a problem with the code, the underlying server, the network, a third-party API, or something else entirely?
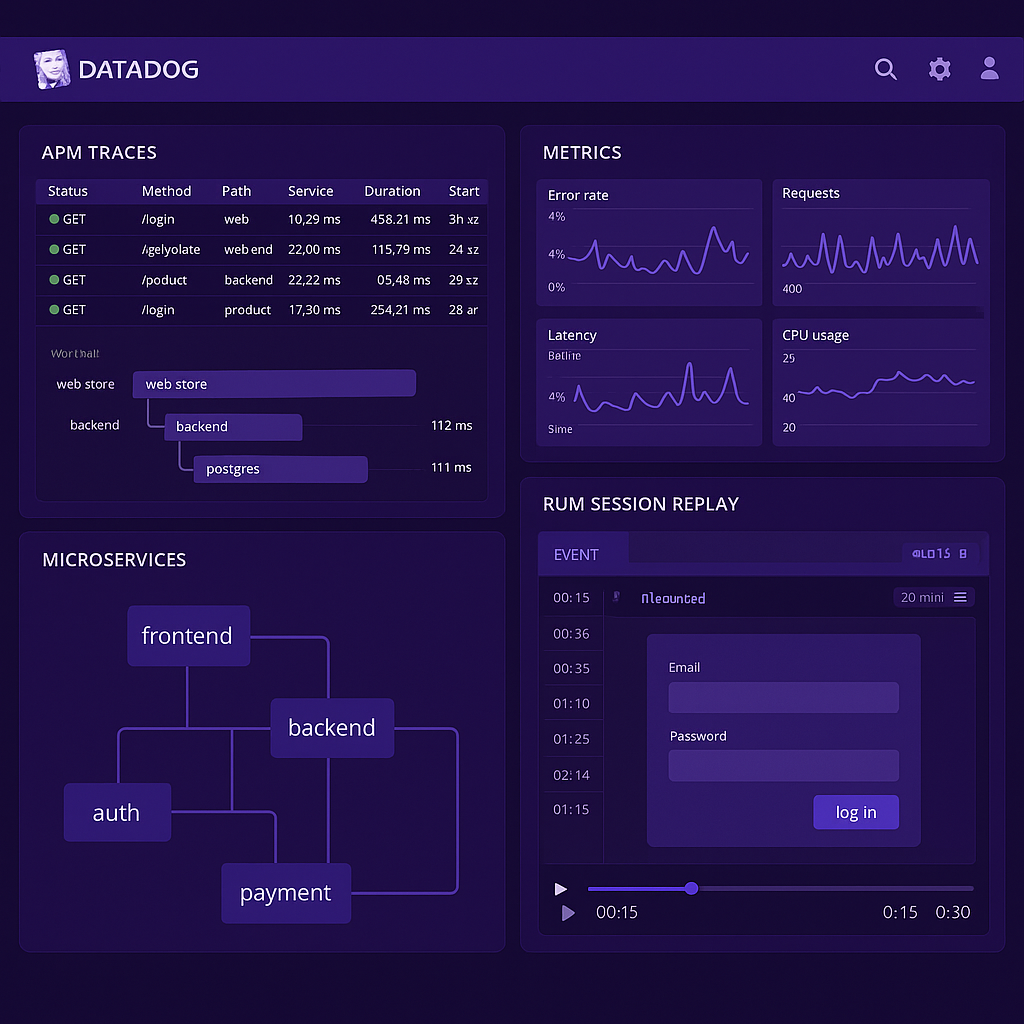
Datadog’s core strength is its ability to break down these silos. It correlates the “three pillars of observability” (metrics, traces, and logs) into a single, interconnected view. This unified data model is the secret sauce.
Let’s break that down. Metrics provide a high-level, quantitative look at system health (e.g., CPU usage, error rates). Traces follow a single request as it travels through multiple services, providing a detailed map of its journey and identifying bottlenecks. Logs offer granular, timestamped events that provide the ground-level truth of what happened at a specific moment in time.
Historically, these were the domains of separate tools. Datadog brings them together. An engineer can see a spike in an error metric, drill down to the specific traces that are failing, and then jump directly to the relevant logs to see the exact error message, all within a single interface. This dramatically reduces the Mean Time to Resolution (MTTR).
Observability for Microservices and User Experience
Insights distilled from numerous complex system deployments indicate that this unified approach is particularly critical for organizations that have adopted microservices architectures. In a monolithic application, tracing a problem is relatively straightforward.
In a microservices environment, a single user request might touch dozens of different services. Without a platform like Datadog that can stitch together the entire journey, debugging becomes a nightmare of detective work. Datadog’s ability to provide end-to-end visibility is not just a convenience; it’s a necessity for maintaining service reliability.
Furthermore, Datadog extends its observability capabilities beyond the backend. With Real User Monitoring (RUM) and Session Replay, teams can understand the user’s actual experience. This connects frontend performance issues directly to backend traces and logs.
This creates a complete picture, from a user clicking a button in their browser all the way down to the database query that serves their request. It’s this full-stack view that allows organizations to move from a reactive to a proactive stance on performance and reliability.
Cost Management and Implementation Strategy
Strategic Investment in Visibility
Of course, the platform’s comprehensive nature comes at a cost, and managing that cost requires discipline. The sheer volume of data that can be ingested into Datadog can be staggering. Organizations must be strategic about what they collect and for how long. (This is a data governance challenge in its own right).
However, for enterprises running mission-critical applications in complex, distributed environments, the investment in a unified observability platform is often justified by the reduction in downtime and the increased productivity of engineering teams.
Advanced Analytics and Machine Learning Capabilities
Datadog’s platform extends beyond traditional monitoring through sophisticated analytics and machine learning features. Anomaly detection algorithms automatically identify unusual patterns in metrics, reducing the need for manual threshold setting and enabling proactive issue identification.
Forecasting capabilities help capacity planning by predicting future resource needs based on historical trends and seasonal patterns. This predictive approach enables organizations to scale infrastructure proactively rather than reactively, improving both performance and cost optimization.
Watchdog, Datadog’s AI-powered root cause analysis feature, automatically surfaces potential issues and correlates them across different layers of the stack. This reduces the cognitive load on engineering teams and accelerates problem resolution by highlighting the most likely causes of system anomalies.
Integration Ecosystem and API-First Architecture
The platform’s strength lies not just in its native capabilities but in its extensive integration ecosystem. Out-of-the-box integrations with hundreds of technologies enable rapid deployment across diverse technology stacks without extensive custom development.
API-first design allows organizations to programmatically manage their observability infrastructure, enabling Infrastructure as Code approaches that align with modern DevOps practices. This programmability extends to alerting, dashboard creation, and data export, supporting sophisticated automation workflows.
Custom metrics and distributed tracing SDKs enable organizations to instrument proprietary applications and business logic, ensuring that observability extends beyond infrastructure to include business-critical processes and outcomes.
Security and Compliance Considerations
Enterprise adoption requires careful attention to security and compliance requirements. Data residency options allow organizations to maintain sensitive data within specific geographic regions, addressing regulatory requirements and data sovereignty concerns.
Role-based access controls ensure that sensitive monitoring data remains accessible only to authorized personnel, while audit logging provides accountability for configuration changes and data access patterns.
Integration with security tools enables correlation between observability data and security events, supporting both operational and security use cases within unified workflows.
Organizational Impact and Team Dynamics
Implementing comprehensive observability transforms organizational dynamics beyond technical capabilities. Shared visibility across development, operations, and business teams creates common understanding of system health and user experience impact.
Blameless post-mortems benefit from complete system visibility, enabling teams to focus on process improvement rather than fault assignment. The detailed trace and log data supports thorough root cause analysis that identifies systemic issues rather than individual mistakes.
On-call efficiency improves dramatically when engineers have immediate access to relevant context during incidents, reducing stress and improving resolution times through better information availability.
Strategic Implementation Roadmap
Organizations planning Datadog adoption should consider a phased approach that balances immediate value with long-term strategic goals. Initial deployment typically focuses on critical applications and services, establishing baseline monitoring capabilities and demonstrating value to stakeholders.
Expansion phases gradually incorporate additional services, custom metrics, and advanced features like RUM and profiling. This approach allows teams to develop expertise progressively while managing costs and complexity.
Maturity optimization involves leveraging advanced analytics, automation, and integration capabilities to create sophisticated observability practices that support business objectives beyond basic monitoring.
In a world where digital experience is paramount, you can’t fix what you can’t see. Datadog provides the “eyes and ears” for modern technology stacks, making it a truly strategic enterprise system that enables organizations to maintain competitive advantage through superior operational excellence.
Let’s discuss this further on LinkedIn.