Table of Contents
The Unique Financial Puzzle of Power Generation
Financial leaders in the power generation industry face a particularly complex puzzle, don’t they? Tracking financial performance isn’t straightforward when your portfolio includes diverse energy sources (solar, wind, hydroelectric, geothermal, maybe even traditional fossil fuels or emerging technologies like battery storage. Each method comes with its own distinct cost structure (think high upfront capital for renewables vs. ongoing fuel costs), unique maintenance cycles, differing regulatory incentives or hurdles, and revenue patterns often influenced by unpredictable factors like weather or fluctuating commodity prices. Creating a unified, coherent financial view out of this complex mix requires truly thoughtful dashboard design. It’s not just about plotting revenue; it’s about understanding the interplay between these diverse streams.
To explore these challenges, I recently developed a custom React-based financial dashboard concept specifically for tracking the performance of a hypothetical power generation company. This demonstration project, while not representing a real company’s data, serves to highlight some important principles that can be applied across the broader energy sector when designing effective financial visualizations.
Introducing the Oliver Energy Financial Dashboard Concept
The custom financial dashboard concept developed for “Oliver Energy” is designed to show how complex financial and related operational data can be integrated and presented to provide genuinely actionable insights for executives in this sector. It’s about moving beyond static spreadsheets to dynamic visual analysis.
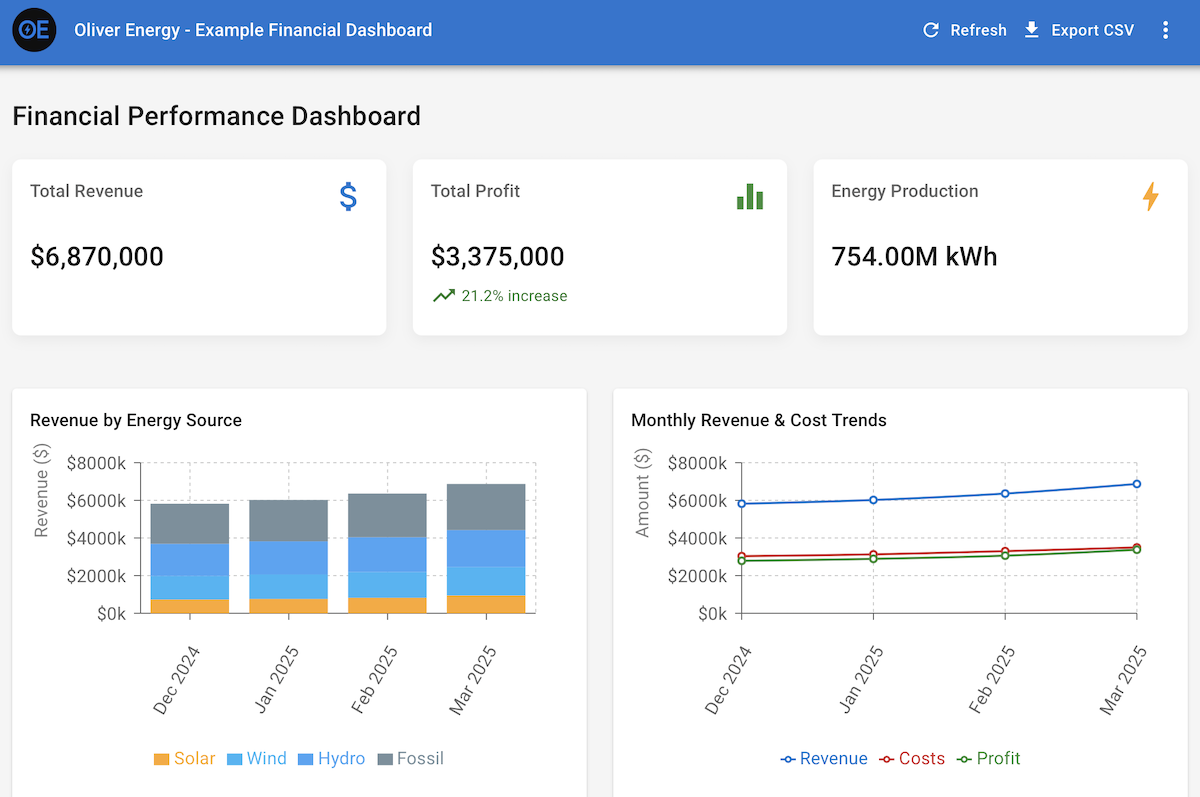
What makes it potentially effective? It starts by prominently displaying the most critical, top-line metrics for immediate visibility) think Total Revenue ($6,870,000), Total Profit ($3,375,000), and overall Energy Production (754.00M kWh) in this example. This immediately answers the “How are we doing overall?” question. From there, it allows users to explore revenue breakdown by energy source, monthly revenue and cost trends, weather hedge performance, and regional performance analysis. This layered approach embodies a core dashboard design principle: prioritize information based on decision importance. Critical metrics need to be front-and-center, with intuitive paths to drill down into the supporting details.
Tech Stack Choices: React vs. BI Platforms
For this specific demonstration, the dashboard was built using React.js for the frontend interface, a technical choice I explore in more detail in Building Custom React Dashboards for Financial Data: A Technical Guide. The visualizations rely on custom chart components, developed using a library like Chart.js. This approach offers maximum design flexibility, allows for highly tailored user interactions, and provides complete control over the look and feel. The responsive design ensures it adapts well to various screen sizes (desktop, tablet). Architecturally, the data would likely be structured around dimensions like energy source, time periods (day, month, year), and region to enable flexible slicing and dicing.
However, let’s be practical. Building a fully custom React dashboard requires significant frontend development expertise and ongoing maintenance. For many organizations, especially those already invested in the Microsoft or Salesforce ecosystems, Power BI or Tableau present excellent, often more accessible, alternatives. For instance, Power BI integrates tightly with other Microsoft products (Azure, Dynamics GP, Excel), offers robust data modeling capabilities (DAX), and is often cost-effective if you already have Microsoft 365 licenses. Tableau, on the other hand, is known for its strong visualization capabilities, ease of use in creating interactive charts, and powerful data exploration features.
Both platforms can connect to a wide range of data sources, including enterprise systems like Microsoft Dynamics GP or NetSuite, SCADA systems, or dedicated energy trading and risk management (ETRM) platforms. The choice often comes down to existing infrastructure, in-house skills, specific visualization needs, and budget. The principles of good dashboard design remain the same regardless of the tool.
Key Insights Revealed by This Dashboard Design
Even as a conceptual example, this type of dashboard design readily surfaces insights crucial for energy sector management. One key insight is the Value of Diversification; the ‘Revenue by Energy Source’ visualization makes the benefits (or drawbacks) of a diversified generation portfolio immediately obvious. You can instantly see how reliant the company is on any single source and how different sources contribute to overall revenue stability (or volatility). Another is the Effectiveness of Risk Management; the ‘Weather Hedge Performance’ chart isn’t just an abstract financial metric but directly demonstrates the tangible financial impact of risk management strategies (like weather derivatives) designed to smooth out the revenue fluctuations inherent in weather-dependent renewables. Finally, observing Profitability Trends & Scaling by watching the gap between revenue and cost lines in monthly trends can quickly highlight whether the company is successfully improving economies of scale, managing costs effectively as production grows, or facing margin pressure.
Critical Implementation Considerations
Thinking about implementing a similar dashboard in your own power generation or energy trading organization? Based on analyzing successful projects, and aligning with general financial dashboard design principles, keep several factors front-of-mind. First, start with Stakeholder Needs. Don’t begin by gathering data; conduct thorough interviews with key decision-makers to deeply understand the specific decisions they need the dashboard to support. Second, prioritize Ruthlessly. Identify the absolute most critical metrics and KPIs and ensure they dominate the top-level view for immediate “at-a-glance” understanding.
Third, tailor for Different Audiences. Recognize that an executive needs a high-level summary, while a financial analyst needs to drill down into granular detail. Design different views or implement robust filtering/drill-down capabilities. Fourth, remember that simplicity Breeds Clarity. Strive for clear, uncluttered visualizations. The goal is instant comprehension, not dazzling visual complexity. Lastly, enable Exploration by implementing intuitive filters and drill-down paths that empower users to explore data and answer their own follow-up questions.
Potential Future Enhancements
Where could a dashboard like this go next? Future iterations could incorporate predictive analytics for forecasting future energy production or potential equipment failures. Integrating operational metrics like plant uptime or equipment efficiency would also add value. Furthermore, tracking environmental impact, such as CO2 emissions avoided, alongside financial performance, or exploring implementations using different BI tools or direct ETRM integration, are all viable paths for enhancement.
You can interact with the live dashboard demo here to get a feel for how these design principles translate into a user experience. The core concepts (clear visualization hierarchy, providing context through benchmarks (even if not explicitly shown in this simple demo), and enabling exploration) are applicable far beyond just the energy sector.
What financial or operational metrics are most critical in your specific industry? What challenges do you face in visualizing them effectively? Let’s exchange ideas over on LinkedIn.